
Home / Insights / The cyberrisk quantification journey
Insights · published research
The Cyberrisk Quantification Journey
Many organisations suffer from being unaware of their levels of cyberrisk, and lack business engagement in cybertechnology. This article walks the full journey — risk scenarios, control assessment, FAIR quantification and machine learning — and shows why a qualitative risk profile cannot prioritise remediation, while a quantified one can.
By David Vohradsky, CISA, CRISC, CISM, CGEIT, CDPSE. First published in the ISACA Journal, Volume 2, 2022, pages 19–32, and republished here in full with permission. The worked example throughout is a hypothetical health services organisation; all monetary values in it are illustrative, not measured outcomes.
Many organizations suffer from being unaware of their levels of cyberrisk and lack business engagement in cybertechnology in general. Cybersecurity improvements are often capability based and led by IT; however, many cybersecurity practitioners are unable to obtain funding for holistic cybertransformation programs because they do not speak the same language as those operating the business.
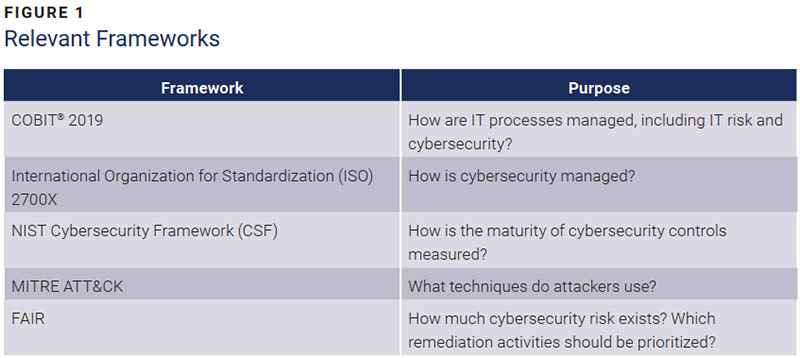
To resolve these issues, organizations must embark on cyberrisk journeys that include identifying risk scenarios, developing risk profiles (possibly as part of an enterprise risk management [ERM] exercise), using frameworks such as those shown in figure 1 to assess controls, and using Factor Analysis of Information Risk (FAIR) to assess risk and determine optimal remediation road maps. The final part of the journey is the use of machine learning to reduce subjectivity and increase the cadence of work.
Risk Scenarios
COBIT is a useful framework for IT processes and IT general controls. The overall COBIT risk management process (Align, Plan and Organize [APO] APO12 Manage Risk) consists of collecting data, analyzing risk, maintaining a risk portfolio, articulating or communicating risk, defining a risk management action portfolio and responding to risk. Risk analysis is the process used to estimate the frequency and magnitude of a given risk scenario — identifying and evaluating a risk and its potential impact on the organization. Risk assessment is a broader process that includes ranking risk, grouping like risk areas and documenting existing controls.
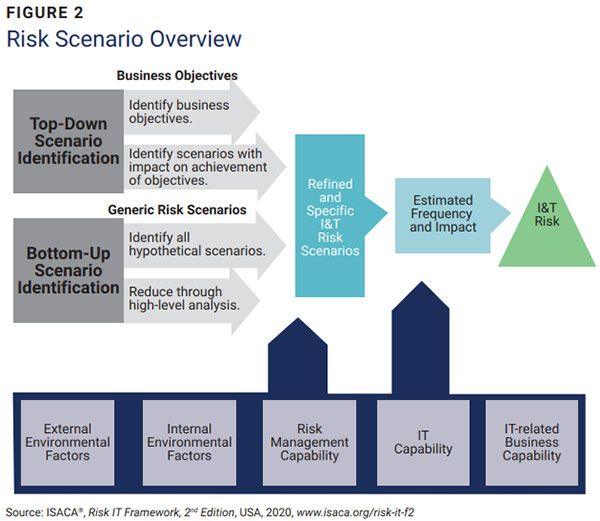
As shown in figure 2, cyberrisk scenarios can be identified top down from business objectives or bottom up beginning with a list of potential threat actors, event types, target assets and types of impact. The starting point should be a discussion about what the business does, what data and systems are used, and the risk factors related to the external competitive and cyberthreat environment and internal business and technical environment.
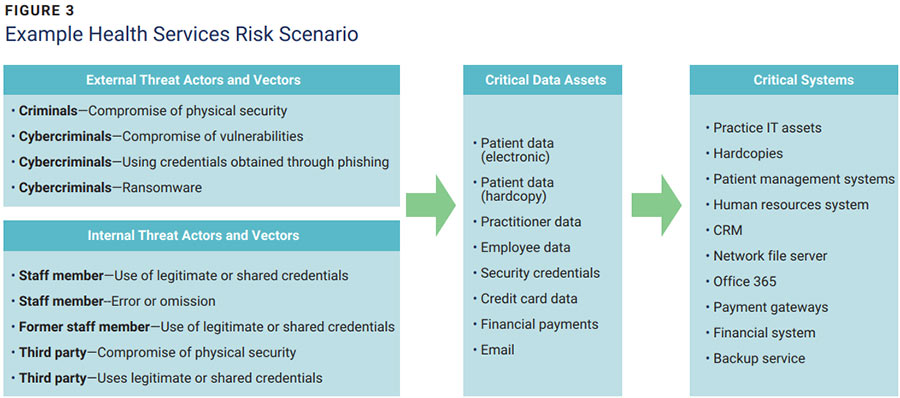
Figure 3 shows an example risk scenario for a health services organization. In this case, the threat actors are cybercriminals, internal staff and third parties, and the threat vectors include phishing, vulnerabilities, ransomware and unauthorized access. For a more granular approach, it is possible to work out attacks based on the MITRE ATT&CK Framework, a framework of adversary tactics, techniques and their possible mitigations based on real-world observations, to validate the reasonableness of the scenarios. The critical data assets are patient, practitioner and employee data, and payments and security credentials, which means that the critical systems are those supporting the critical data assets.
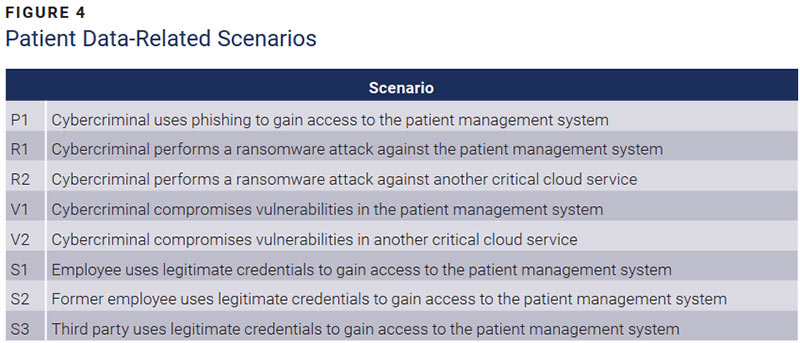
The risk scenarios derived from the material combinations of actors, attack vectors and assets, shown in figure 4 (for patient data), can be used as examples for this use case.
A Simple Threat and Risk Assessment
Cyberrisk is the combination of the likelihood of an event (risk scenario) and its impact. There are three methods of analyzing this risk: qualitative, quantitative and a hybrid of the two (semiquantitative).
The simple qualitative approach is to create a table that compares the likelihood and impact of each risk scenario. This is useful for communicating risk to stakeholders and seeking feedback. The International Organization for Standardization (ISO)/International Electrotechnical Commission (IEC) standard ISO/IEC 27005:2011 Information Technology — Security Techniques — Information Security Risk Management contains an example risk assessment matrix, or probability impact graph (PIG), for a simple qualitative risk assessment (figure 5). Typically, this is used in a mirror reverse, with the highest-rated risk in the top right corner.
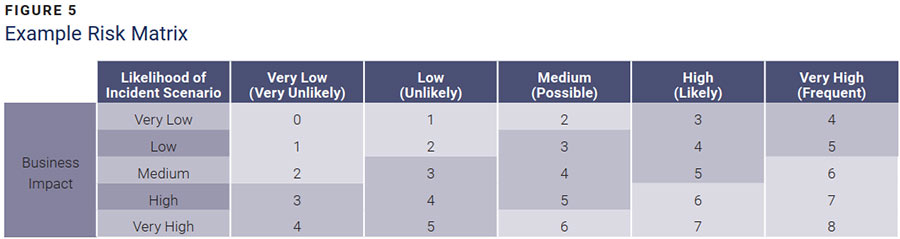
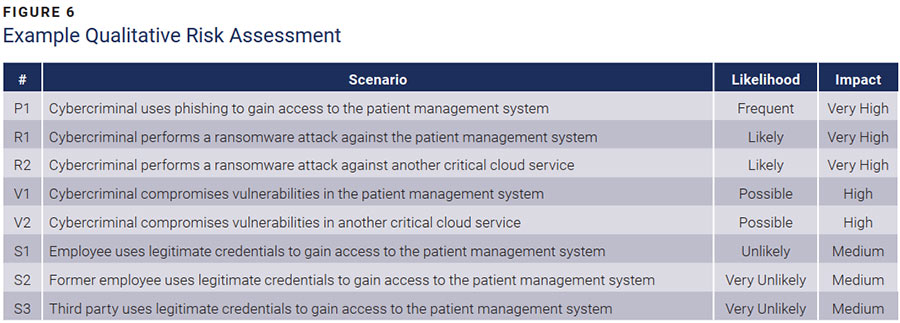
Many other risk analysis and presentation models can be used for such an assessment. The example risk scenarios are assessed by assigning a qualitative likelihood and impact through a five-level Likert scale and plotting the results on a risk matrix to allow communication and stakeholder feedback on the high-rated (red) risk (figures 6 and 7).
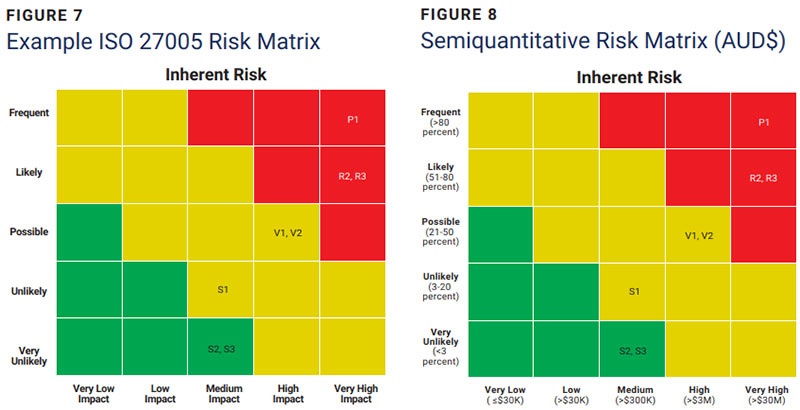
The scales can be linear or logarithmic, using descriptive choices, probabilities, or currency or percentage values, all of which are subjective. Figure 8 shows a semiquantitative risk matrix with the scales defined using probability (for likelihood) and a number or percentage (for impact).
Issues with qualitative and semiquantitative assessments include subjective scoring, difficulty in comparing risk assessed by different stakeholders, difficulty in prioritizing gaps, the ability to cheat the system and the inability to obtain a holistic value of cybersecurity risk. This qualitative approach assumes a linear difference between ratings and that the subjective nature of the description of choices only connotes accuracy, while influencing stakeholder responses in different ways.
Control Assessments
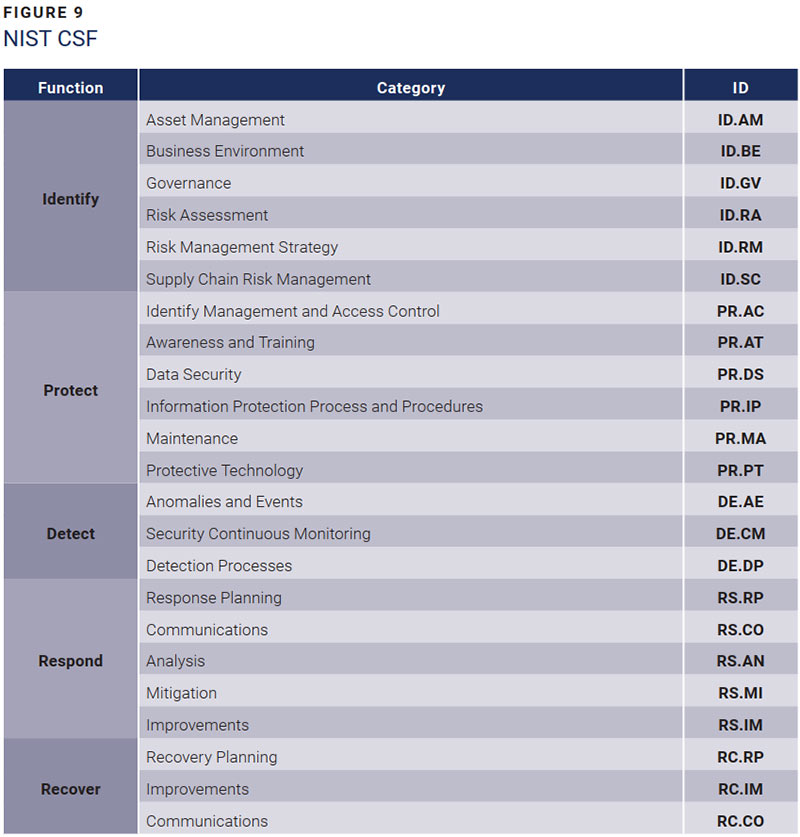
The NIST CSF or a similar control framework is useful in determining the maturity and effectiveness ratings for cybersecurity controls (figure 9).
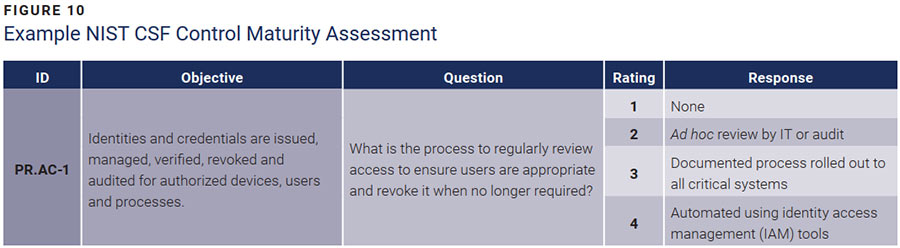
Each of the 77 NIST CSF controls can be assessed using a five-level capability maturity scale reflective of the people, processes and technologies that an organization has implemented for the control (figures 10 and 11). The maturity scale can be based loosely on capability maturity model integration (CMMI). Figure 10 shows a maturity 3 user access review control as being fully documented and used in all critical systems.
Effectiveness refers to how well a control is designed and operating (i.e., whether it is weak, marginal or strong). The effectiveness of NIST CSF controls can be assessed using a control assurance exercise, key control indicators or, in the absence of either, translating from a maturity scale. A smaller set of controls with objectives and effectiveness ratings aggregated from several NIST CSF or NIST Special Publication (SP) SP 800-53 controls can be most useful. In the example case, a possible subjective conclusion is that maturity 0 and 1 are weak, maturity 2 is marginal, and maturity 3 and 4 are strong.
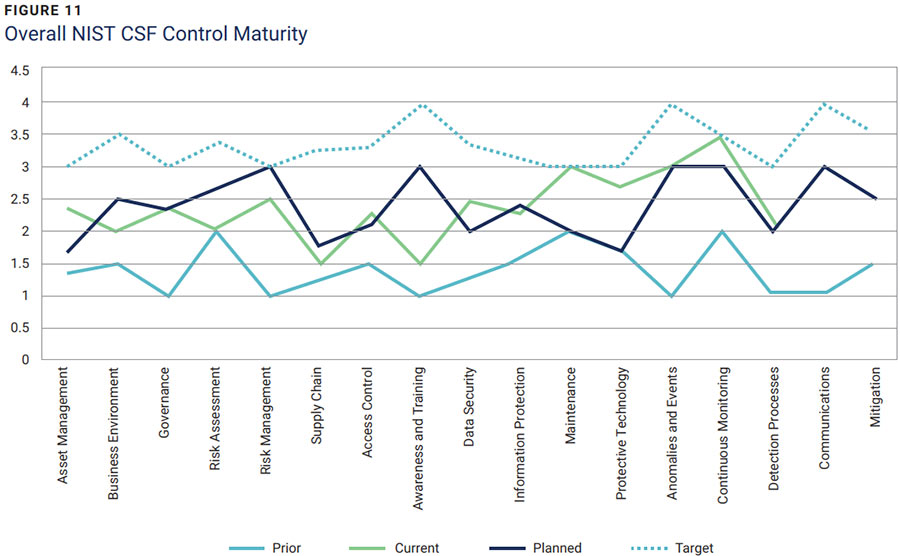

Figure 12 shows an example subset of NIST control effectiveness ratings for the example health services organization. Subjectively, control ratings from the maturity levels in figure 11 can be derived, giving a weak rating for third-party, privileged access management and training because their control maturity levels were less than 2.
Risk Profiles
Following analysis of risk scenarios and assessment of control effectiveness, the next step in the qualitative approach is to subjectively determine current risk for each scenario using a risk profile (figure 13). In this case, the subjective determination is that certain controls are key to mitigating each scenario. This can be worked out more accurately using bow-tie analysis (using cause and consequence diagrams) or through polling (using the Delphi Method).
| ID | Scenario | Inherent risk | Key controls | Control rating | Overall | Current risk |
|---|---|---|---|---|---|---|
| P1 | Cybercriminal uses phishing to gain access to the patient management system | High | Policy framework | Marginal | Marginal | High |
| Authentication | Strong | |||||
| Access management | Strong | |||||
| Privileged access management | Weak | |||||
| User awareness training | Weak | |||||
| Email and web protection | Strong | |||||
| Security logging and monitoring | Strong | |||||
| Security incident response | Marginal | |||||
| V1 | Cybercriminal compromises vulnerabilities in the patient management system | Medium | Policy framework | Marginal | Marginal | Medium |
| Asset inventory | Marginal | |||||
| Secure baseline configuration | Marginal | |||||
| Perimeter security (firewall configuration) | Strong | |||||
| Secure network architecture | Weak | |||||
| Vulnerability and patch management | Marginal | |||||
| Penetration testing | Weak | |||||
| Third-party management | Weak | |||||
| Endpoint protection | Marginal | |||||
| Backup and recovery | Strong | |||||
| Security incident response | Marginal |
In this example, the phishing for patient data scenario is still rated high risk because the overall control rating is marginal. Similarly, the vulnerability scenario is still rated medium risk. A remediation plan for the risk profile could prioritize the weak and marginal key controls related to the high-risk scenario by implementing controls such as privileged access management (PAM) and user awareness training followed by the adoption of a policy framework and incident response plan.
But there is no ability using this qualitative method of risk profiling to prioritize remediation across all risk scenarios or prioritize within the list of weak or marginal key controls. The resulting cybersecurity road map can only be expressed in terms of a control maturity uplift or a subjective determination of criticality using a framework such as the Essential 8.
Cyberrisk Quantification and FAIR
A useful definition of cyberrisk quantification is the process of evaluating cyberrisk scenarios using mathematical modeling techniques in a manner that supports more informed cybersecurity investment decisions. The benefits of quantifying cyberrisk include the ability to increase the engagement of business decision makers on cyberrisk, understand the business impact of cyberrisk, prioritize controls in monetary terms, make better decisions regarding security trade-offs, determine the level of cyberinsurance required and project the return on investment (ROI) of cybersecurity initiatives.
FAIR is an open international standard risk model that was developed specifically to enable quantified risk measurement. FAIR aims to improve objectivity through the calculation of factors including threat event frequency, primary and secondary loss event frequencies, and primary and secondary loss magnitudes (figure 14).
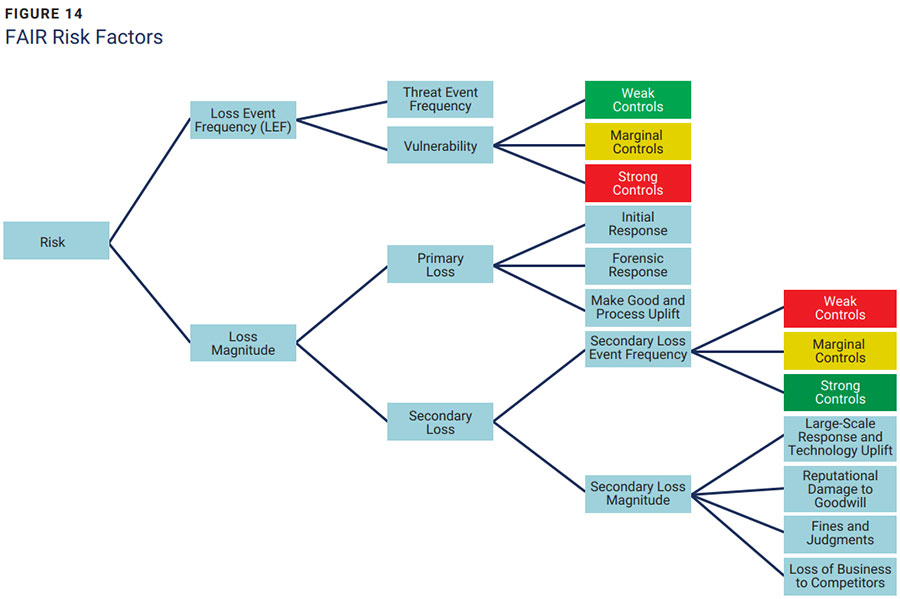
In the FAIR standard, risk is quantified by running a Monte Carlo simulation against each of the risk factors in figure 14 and adding the factors together to determine the resulting primary and secondary annual loss expectancies (ALEs). Monte Carlo simulations are a mathematical way to model the outcomes of a random chain of events, such as each of the factors in the FAIR model.
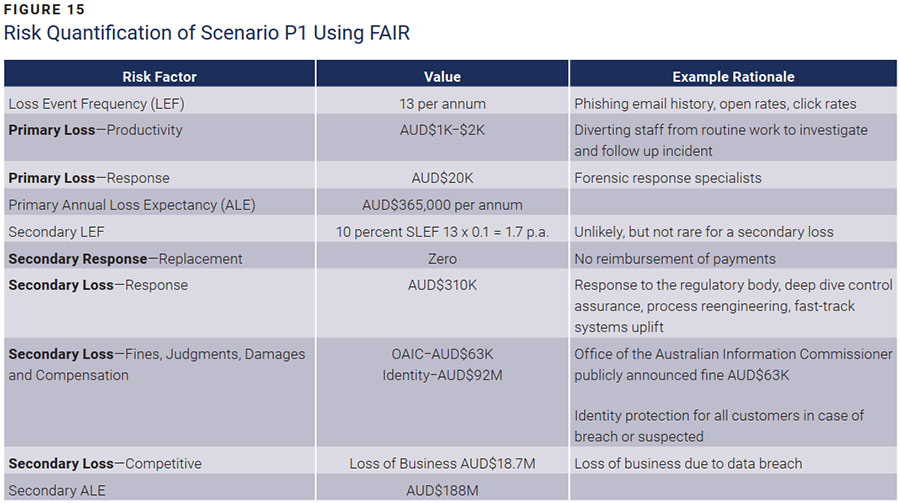
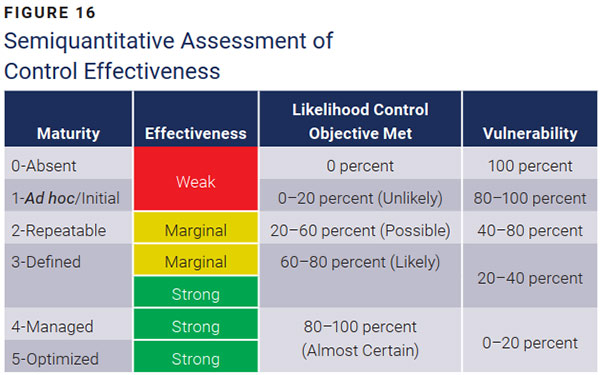
The example shown in figure 15 shows click rates, IT- and business-supplied costs of response, and estimates of consequential damage such as fines, lawsuits and loss of business to calculate an ALE of AUD$188 million for the inherent risk of loss of patient data due to phishing. The vulnerability factor can be semiquantitatively calculated from the subjective control effectiveness. Figure 16 shows a possible way of doing this. A more accurate calculation can be made by conducting a control assurance exercise using audit grade sampling.
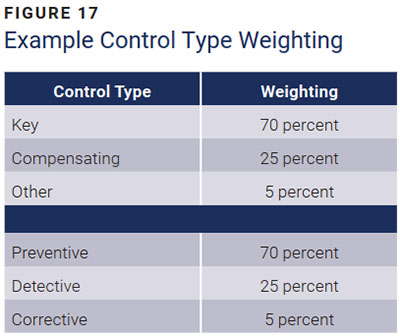
The contribution of an individual control for the overall mitigation of a risk can be semiquantitatively assessed by assigning weightings to control effectiveness based on the type of control. Weightings can be determined semiquantitatively using the analytic hierarchy process (normalized pair-wise comparison of each control using opinions of a small group of small and medium enterprises). Figure 17 shows an example set of weightings for the example case study.
Again, using a normal loss distribution and 50th percentile, a quantified risk profile can be created using a spreadsheet. Figure 18 shows a quantified risk profile using the example case study scenarios. In this case, calculations of the relative contribution of each key control are shown. The relative contribution of each key control and the relative risk buydown possible from control remediation can be determined by totaling the weighted contribution of the controls in AUD dollars. However, a true to standard FAIR risk quantification exercise will require more advanced statistical calculations.
| ID | Scenario | Value at risk | Control type | Weight | Overall vulnerability | Current risk | Value of remediation |
|---|---|---|---|---|---|---|---|
| P1 | Cybercriminal / phishing / patient system | AUD$189.00M | Preventive Detective / corrective | 70% 30% | 47% | AUD$88.20M | AUD$5.15M |
| V1 | Cybercriminal / vulnerabilities / patient system | AUD$23.00M | Preventive Detective / corrective | 70% 30% | 53% | AUD$12.27M | AUD$0.48M |
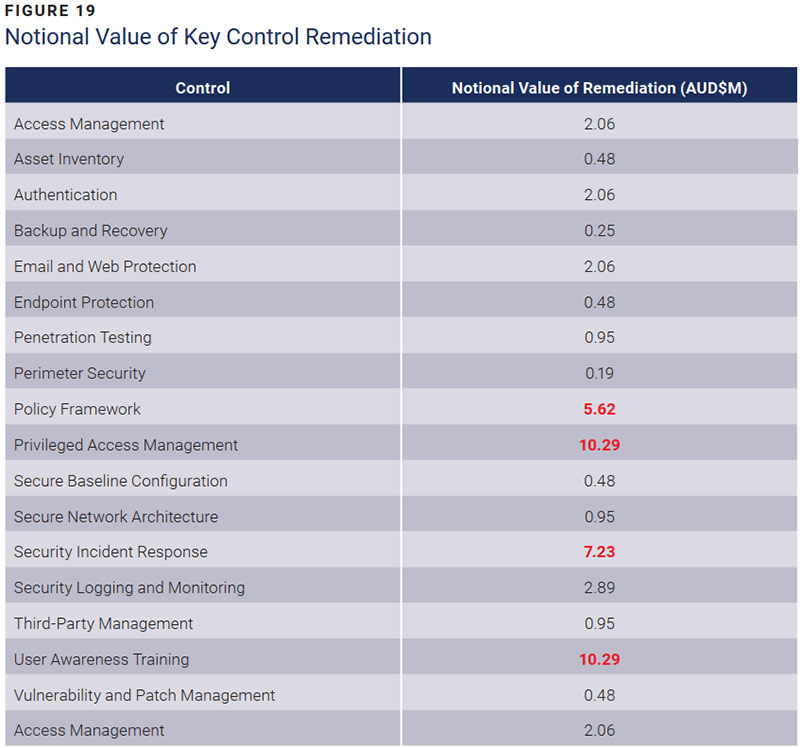
For the example risk profile, figure 19 shows the notional value of remediation of each of the controls across all risk scenarios. Using a quantified risk profile, the remediation plan of prioritizing PAM and user awareness training followed by policy framework and incident response can be confirmed. Quantification allows the policy framework to be prioritized ahead of weak controls within the medium-rated scenario, even though the need is not obvious within the qualitative risk profile.
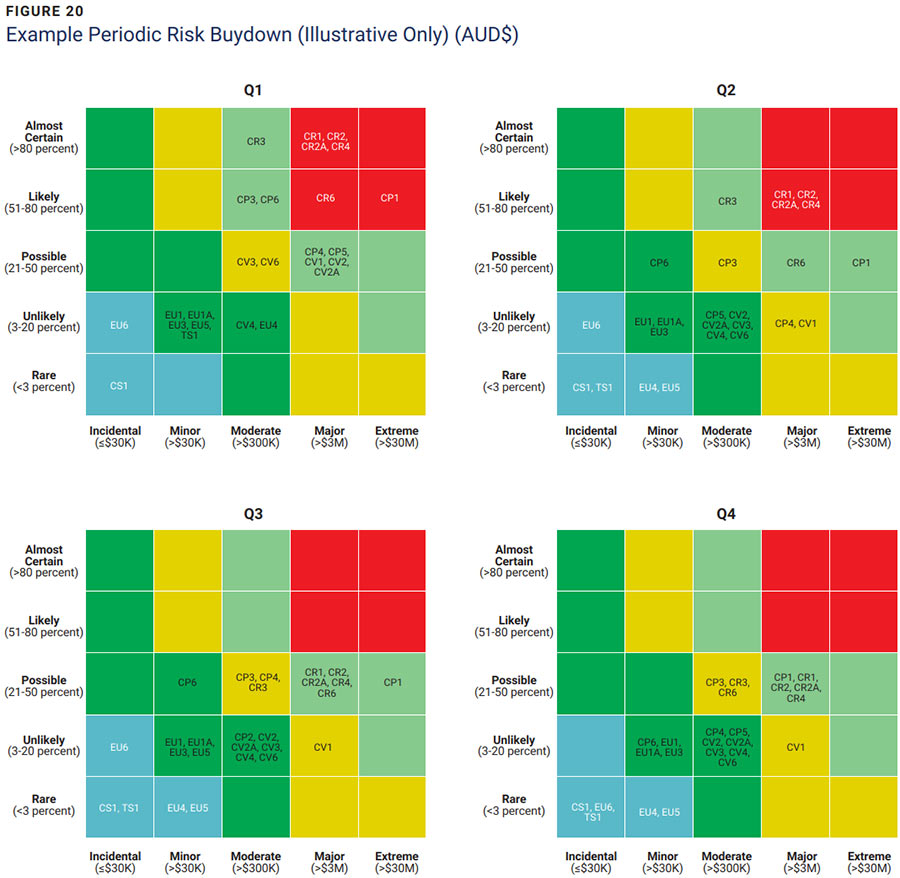
A combination of quantified risk assessments using FAIR and semiquantitative control assessments using NIST CSF can also be used to conduct a what-if analysis to develop a point-in-time optimal cybersecurity road map and to calculate a periodic quantified risk buy down. An example is shown in figure 20.
Issues with quantitative assessments include lack of threat event data to quantify threat event frequency (TEF), actual likelihood or loss event frequency (LEF), lack of subject matter experts, difficulty of placing a quantitative value on subjective elements of vulnerability (especially weighting controls), and secondary losses, such as reputation. Many events are unpredictable and based on speculation rather than on justifiable facts.
Machine Learning
The final stage of the cybersecurity journey is proactive cybersecurity — where "advanced analytics and machine learning are used for preventive detection, and multilayer security-by-design is embedded in all products and services." In current research literature, quantitative techniques include Bayesian analysis, copula, expert systems, fuzzy logic, game theory and utility theory. These techniques have been researched for loss estimation, insurance premium calculation, vulnerability assessment, threat identification and control selection.
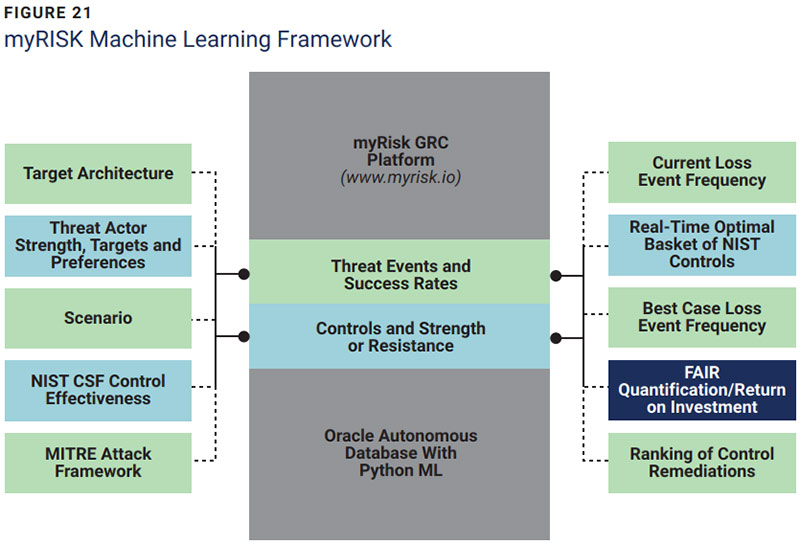
A project at the University of Wollongong, New South Wales, Australia, developed a machine learning cyberquantification platform that will form the basis of a governance, risk and compliance software-as-a-service platform called myRISK. Figure 21 shows the framework for the underlying machine learning model from the project, which includes a MITRE attack graph, a NIST CSF-aligned MITRE defense graph, and a machine learning computation of the probability that a pathway through the MITRE attack framework for a given architecture will be successful for an actor given its relative strength and technique preferences and considering an organization's NIST CSF control effectiveness. The objective of this work is to provide a more accurate quantification of LEF for inclusion in FAIR-based assessments and to provide a real-time control prioritization capability.
Conclusion
A qualitative approach to risk assessment, which involves subjective risk scoring, can lead to difficulty in comparing risk assessed by different stakeholders, difficulty in prioritizing gaps, an inability to holistically value cybersecurity risk and a resulting lack of business engagement. To obtain adequate funding for a holistic cybersecurity transformation program, it is necessary to use a quantitative approach that leverages COBIT, NIST and FAIR frameworks. Quantification increases business engagement and understanding of cyberrisk and allows better decision-making on control improvements based on return on investment (ROI) trade-offs. Issues with quantitative assessments such as lack of threat data, lack of subject matter experts, and subjective factors such as control weighting and reputational losses can be addressed through machine learning.
What to do with this
If you have a specific investment or risk-acceptance decision in front of you, the quantification work MyRISK runs is described on the risk quantification page — scenarios, exposure and the assumptions behind them, framed so the decision can still be explained a year later.
Endnotes
- ISACA, COBIT 2019 Framework: Governance and Management Objectives, USA, 2018
- Ibid.
- Ibid.
- MITRE ATT&CK, attack.mitre.org
- ISACA, CRISC Review Manual, 7th Edition, USA, 2021
- ISO/IEC, ISO/IEC 27005:2011 Information Technology — Security Techniques — Information Security Risk Management, Switzerland, 2011
- Protiviti, Moving Beyond the Heat Map: Making Better Decisions With Cyber Risk Quantification, USA, 2018
- ISACA, Cyberrisk Quantification, USA, 2021
- National Institute of Standards and Technology (NIST), Cybersecurity Framework, USA
- RAND Corporation, "Delphi Method"
- Australian Government and Australian Cyber Security Centre, "Essential Eight"
- RSA Security, Three Essentials for Cyber Risk Quantification, USA
- Op cit Protiviti
- Ayres, D.; J. Schmutte; J. Stanfield; "Expect the Unexpected: Risk Assessment Using Monte Carlo Simulations," Journal of Accountancy, 1 November 2017
- Alexander, R.; "Can the Analytical Hierarchy Process Model Be Effectively Applied in the Prioritization of Information Assurance Defense In-Depth Measures? — A Quantitative Study," Capella University, Minneapolis, Minnesota, USA, February 2017
- Op cit CRISC Review Manual
- Boehm, J.; N. Curcio; P. Merrath; L. Shenton; T. Stahle; "The Risk-Based Approach to Cybersecurity," McKinsey and Company, 8 October 2019
- Mukhopadhyay, A.; S. Chaterjee; K. Bagchi; K. Kallol; P. Kirs; G. Shukla; "Cyber Risk Assessment and Mitigation (CRAM) Framework Using Logit and Probit Models for Cyber Insurance," Information System Frontiers, vol. 21, iss. 5, 17 November 2017
First published as "The Cyberrisk Quantification Journey", ISACA Journal, Volume 2, 2022, pages 19–32. Republished with permission. ISACA, COBIT and the ISACA Journal are trademarks of the Information Systems Audit and Control Association. NIST CSF material is reproduced from the National Institute of Standards and Technology; ISO/IEC 27005 material is reprinted with permission from ISO. Figures and monetary values in the worked example are illustrative. The article describes myRISK as a forthcoming platform arising from University of Wollongong research; it is now MyRISK, and the author is its founder and CEO.